

The status service
One page answers 'is it up?': every public OIML SMART service probed once a minute, the declared availability and latency objectives next to the measured numbers, and a human-written incident record. No account needed, ever.
The live service health. Public; the incident timeline is subscribable as RSS or Atom.
What you can do
Six acts, each performed against the live page before this page listed it; the dated capture is the audit artifact, re-produced by scripts/capture-services.ts on every refresh.
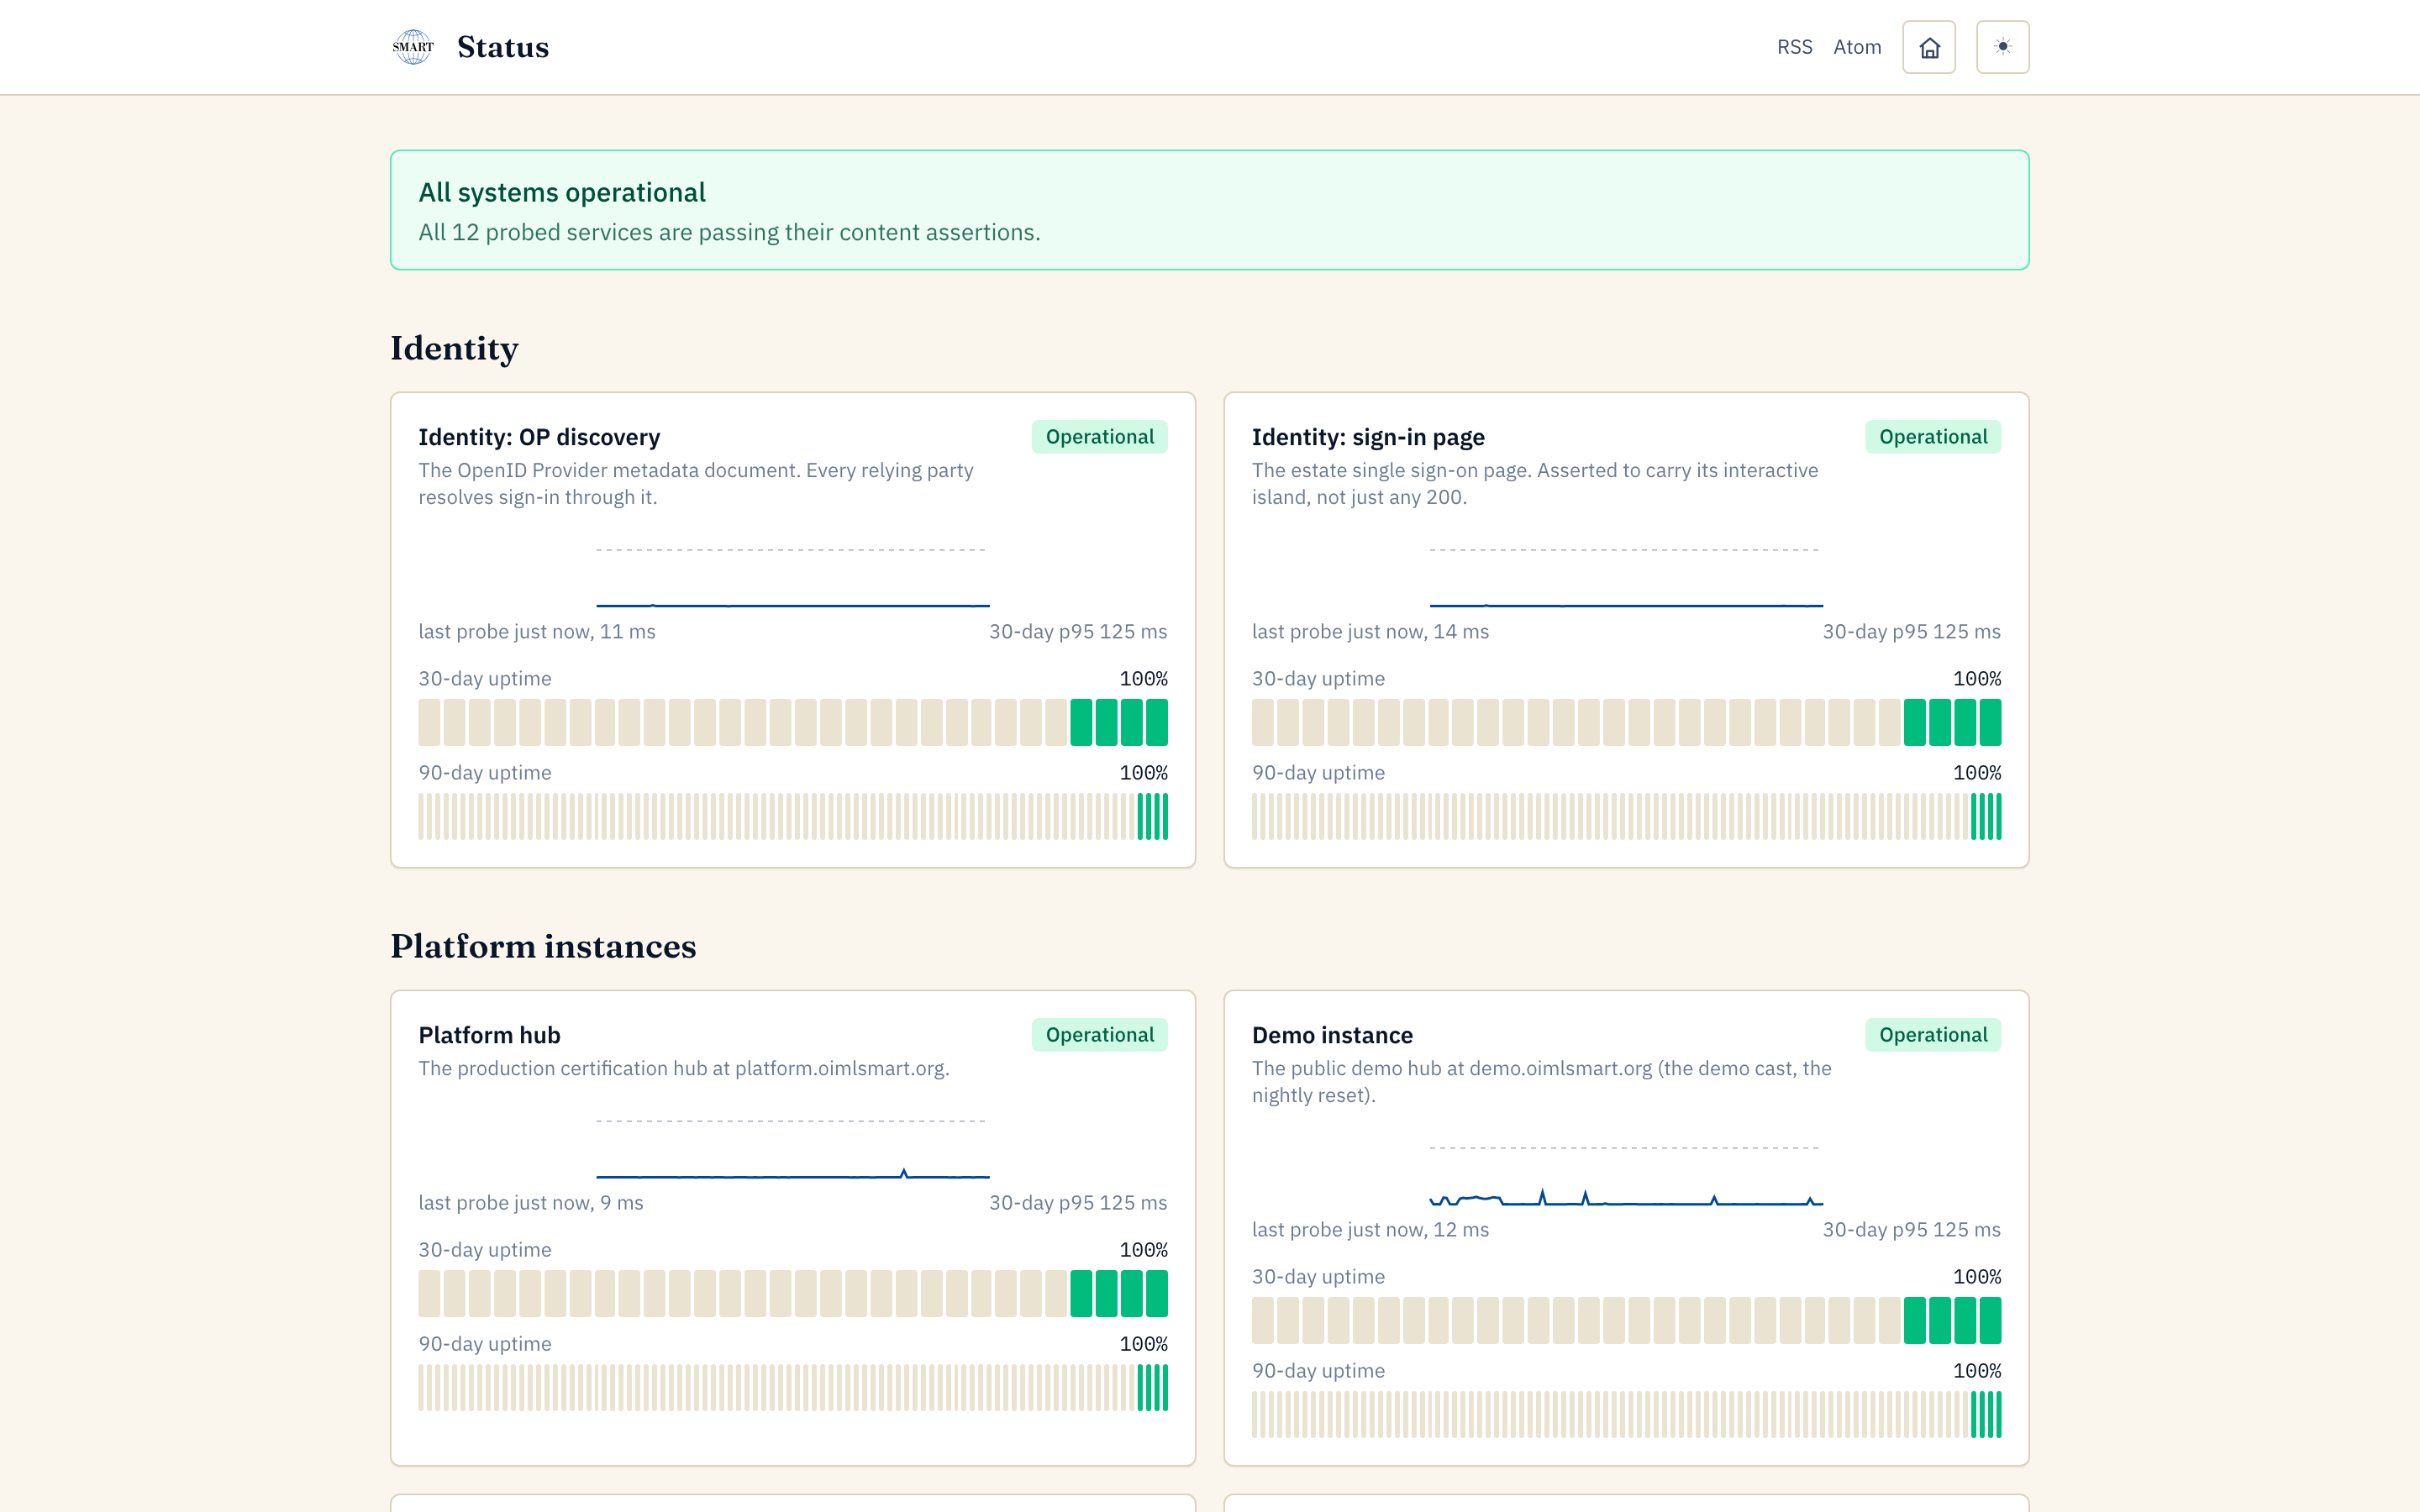
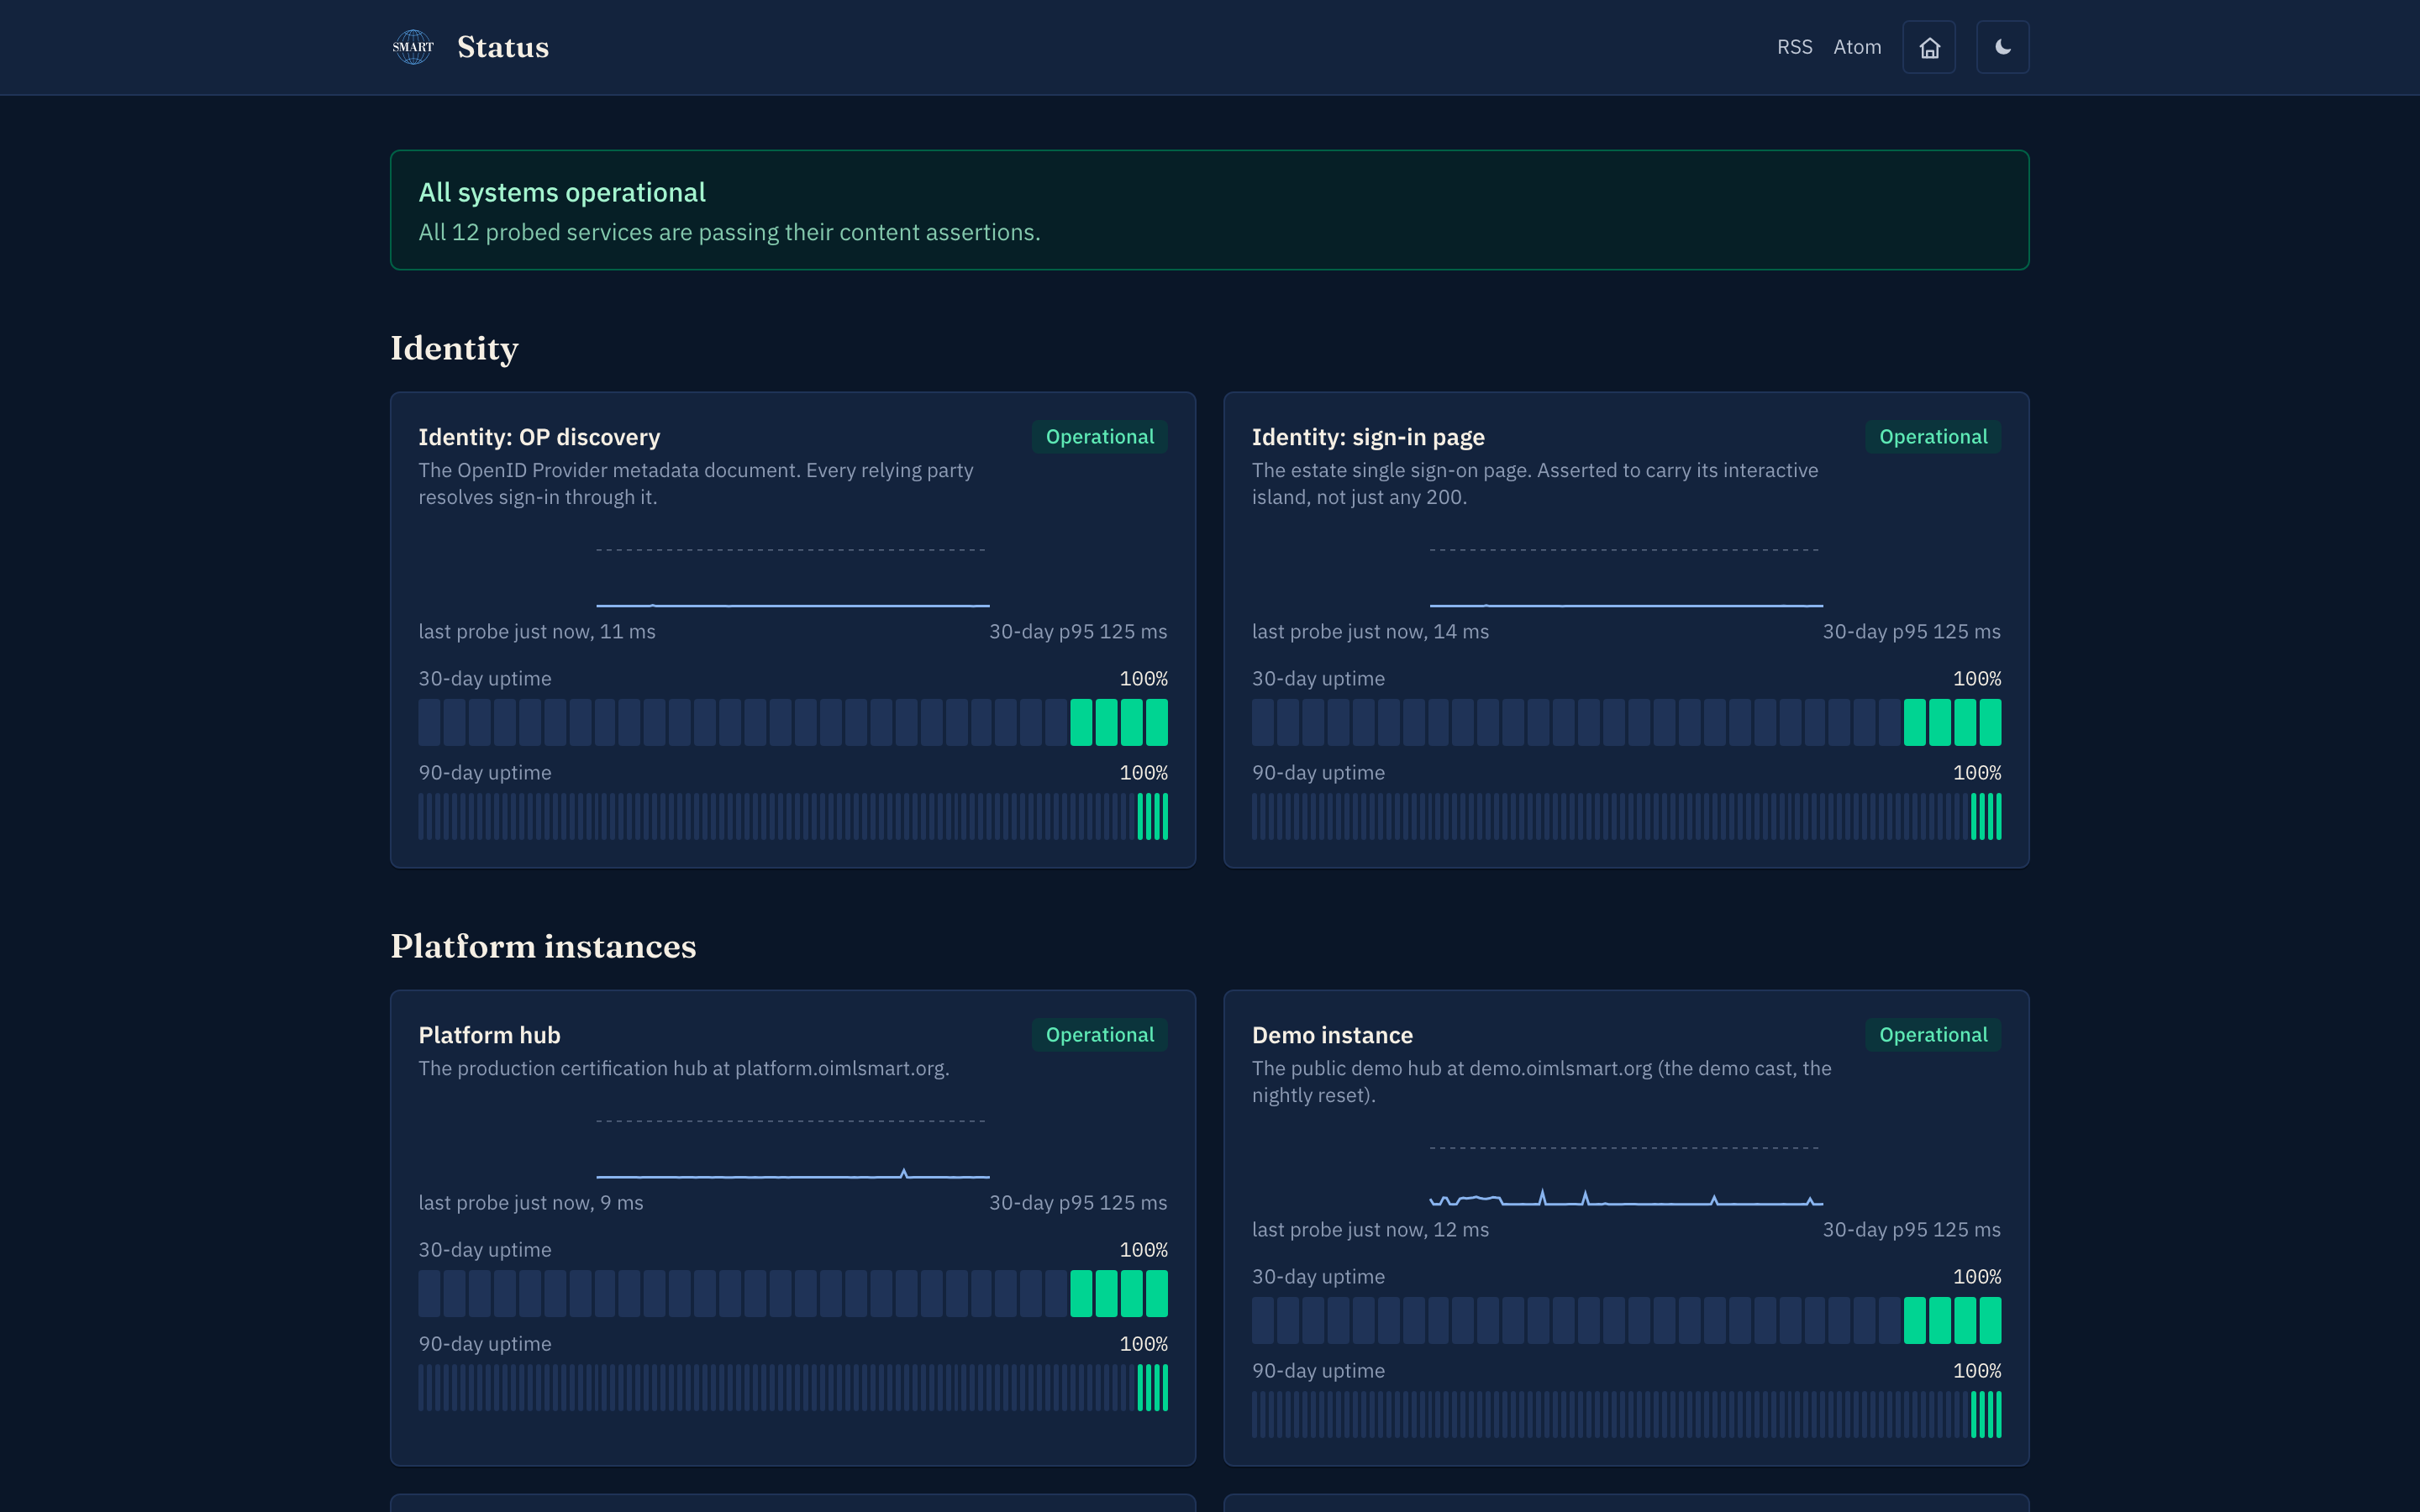
1. See every service at a glance. Twelve probe rows cover the identity service (discovery and sign-in separately), the platform hub and the demo/NMI/TL instances, the Ommisa assistant, and the public surfaces (this site, the vocabulary, the studio viewer, the CNML docs, the concepts registry). One banner answers the only question that matters at 8:55 before a presentation.
The banner and the rows: identity, instances, public surfaces — captured 2026-08-29 by scripts/capture-services.ts 2. Read what a probe actually checks. A probe is not a bare 200: each row carries a content assertion (the identity row asserts the discovery document, the sign-in row asserts the interactive island), so a page that answers with the wrong document fails honestly. Each row shows its last probe, its 30-day p95, and its 30/90-day uptime.
3. Hold the services to their declared objectives. The objectives table puts the declared availability and latency next to the measured actuals, per service, and a number is never rounded up to meet a target.
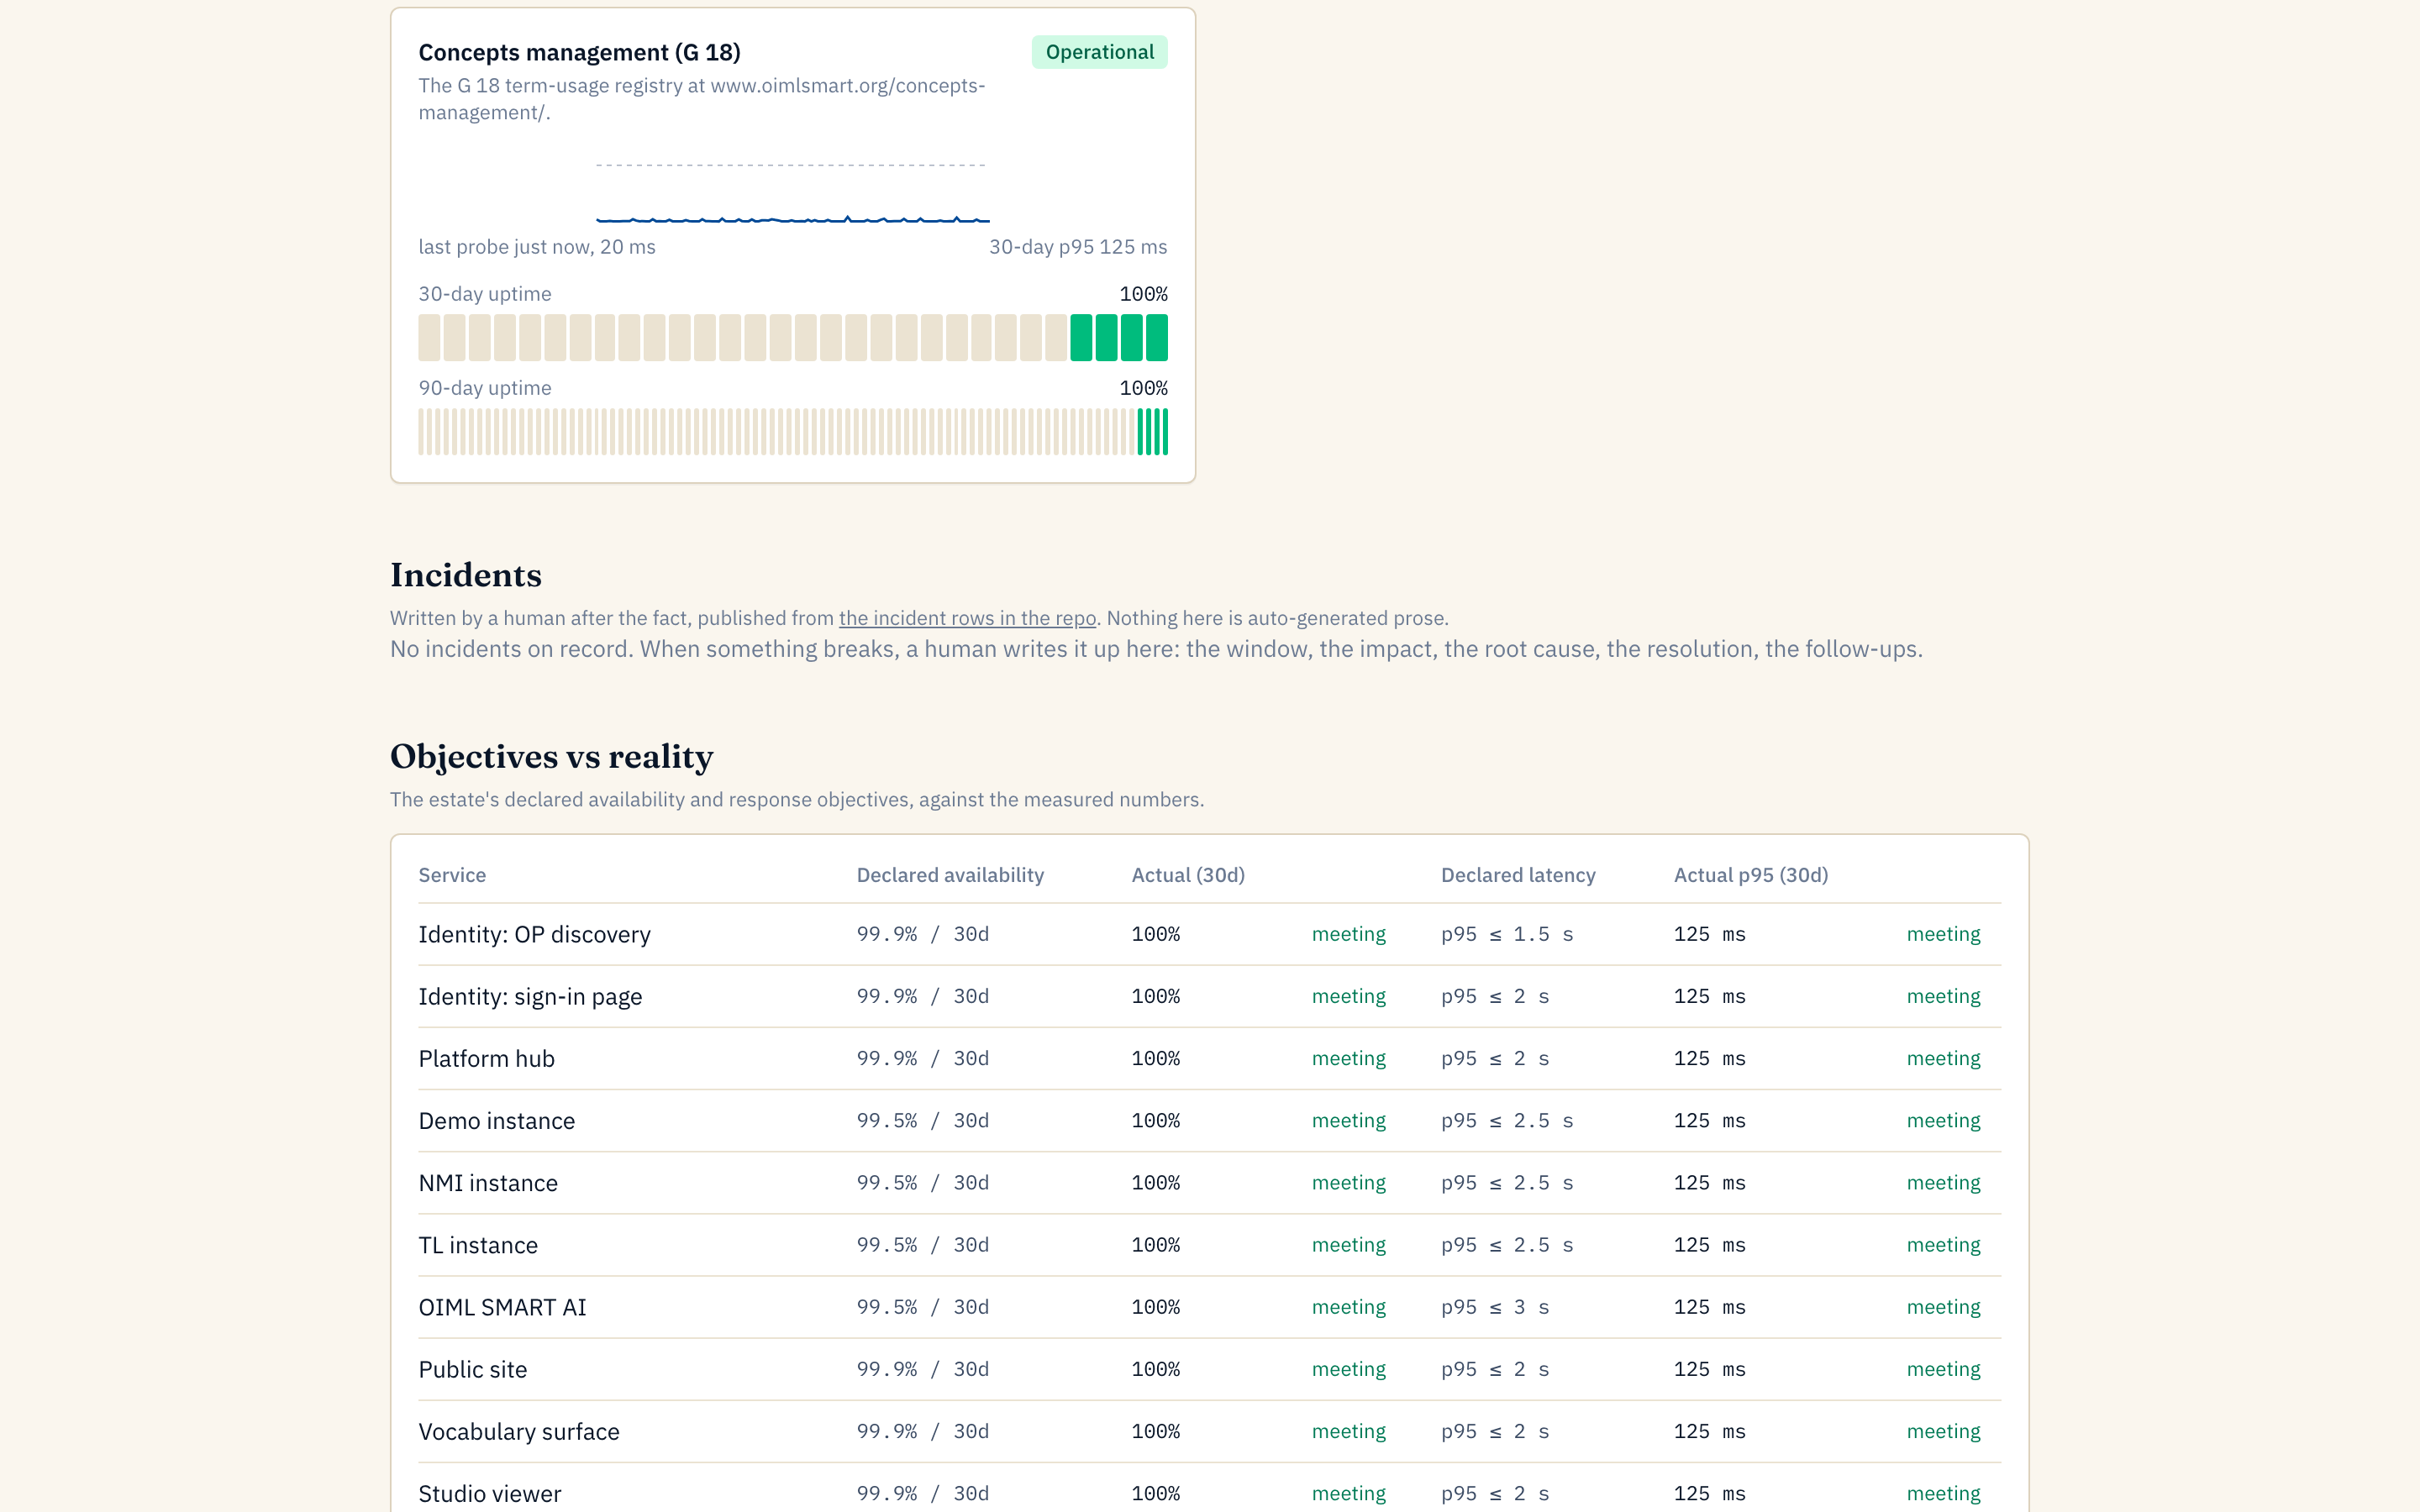
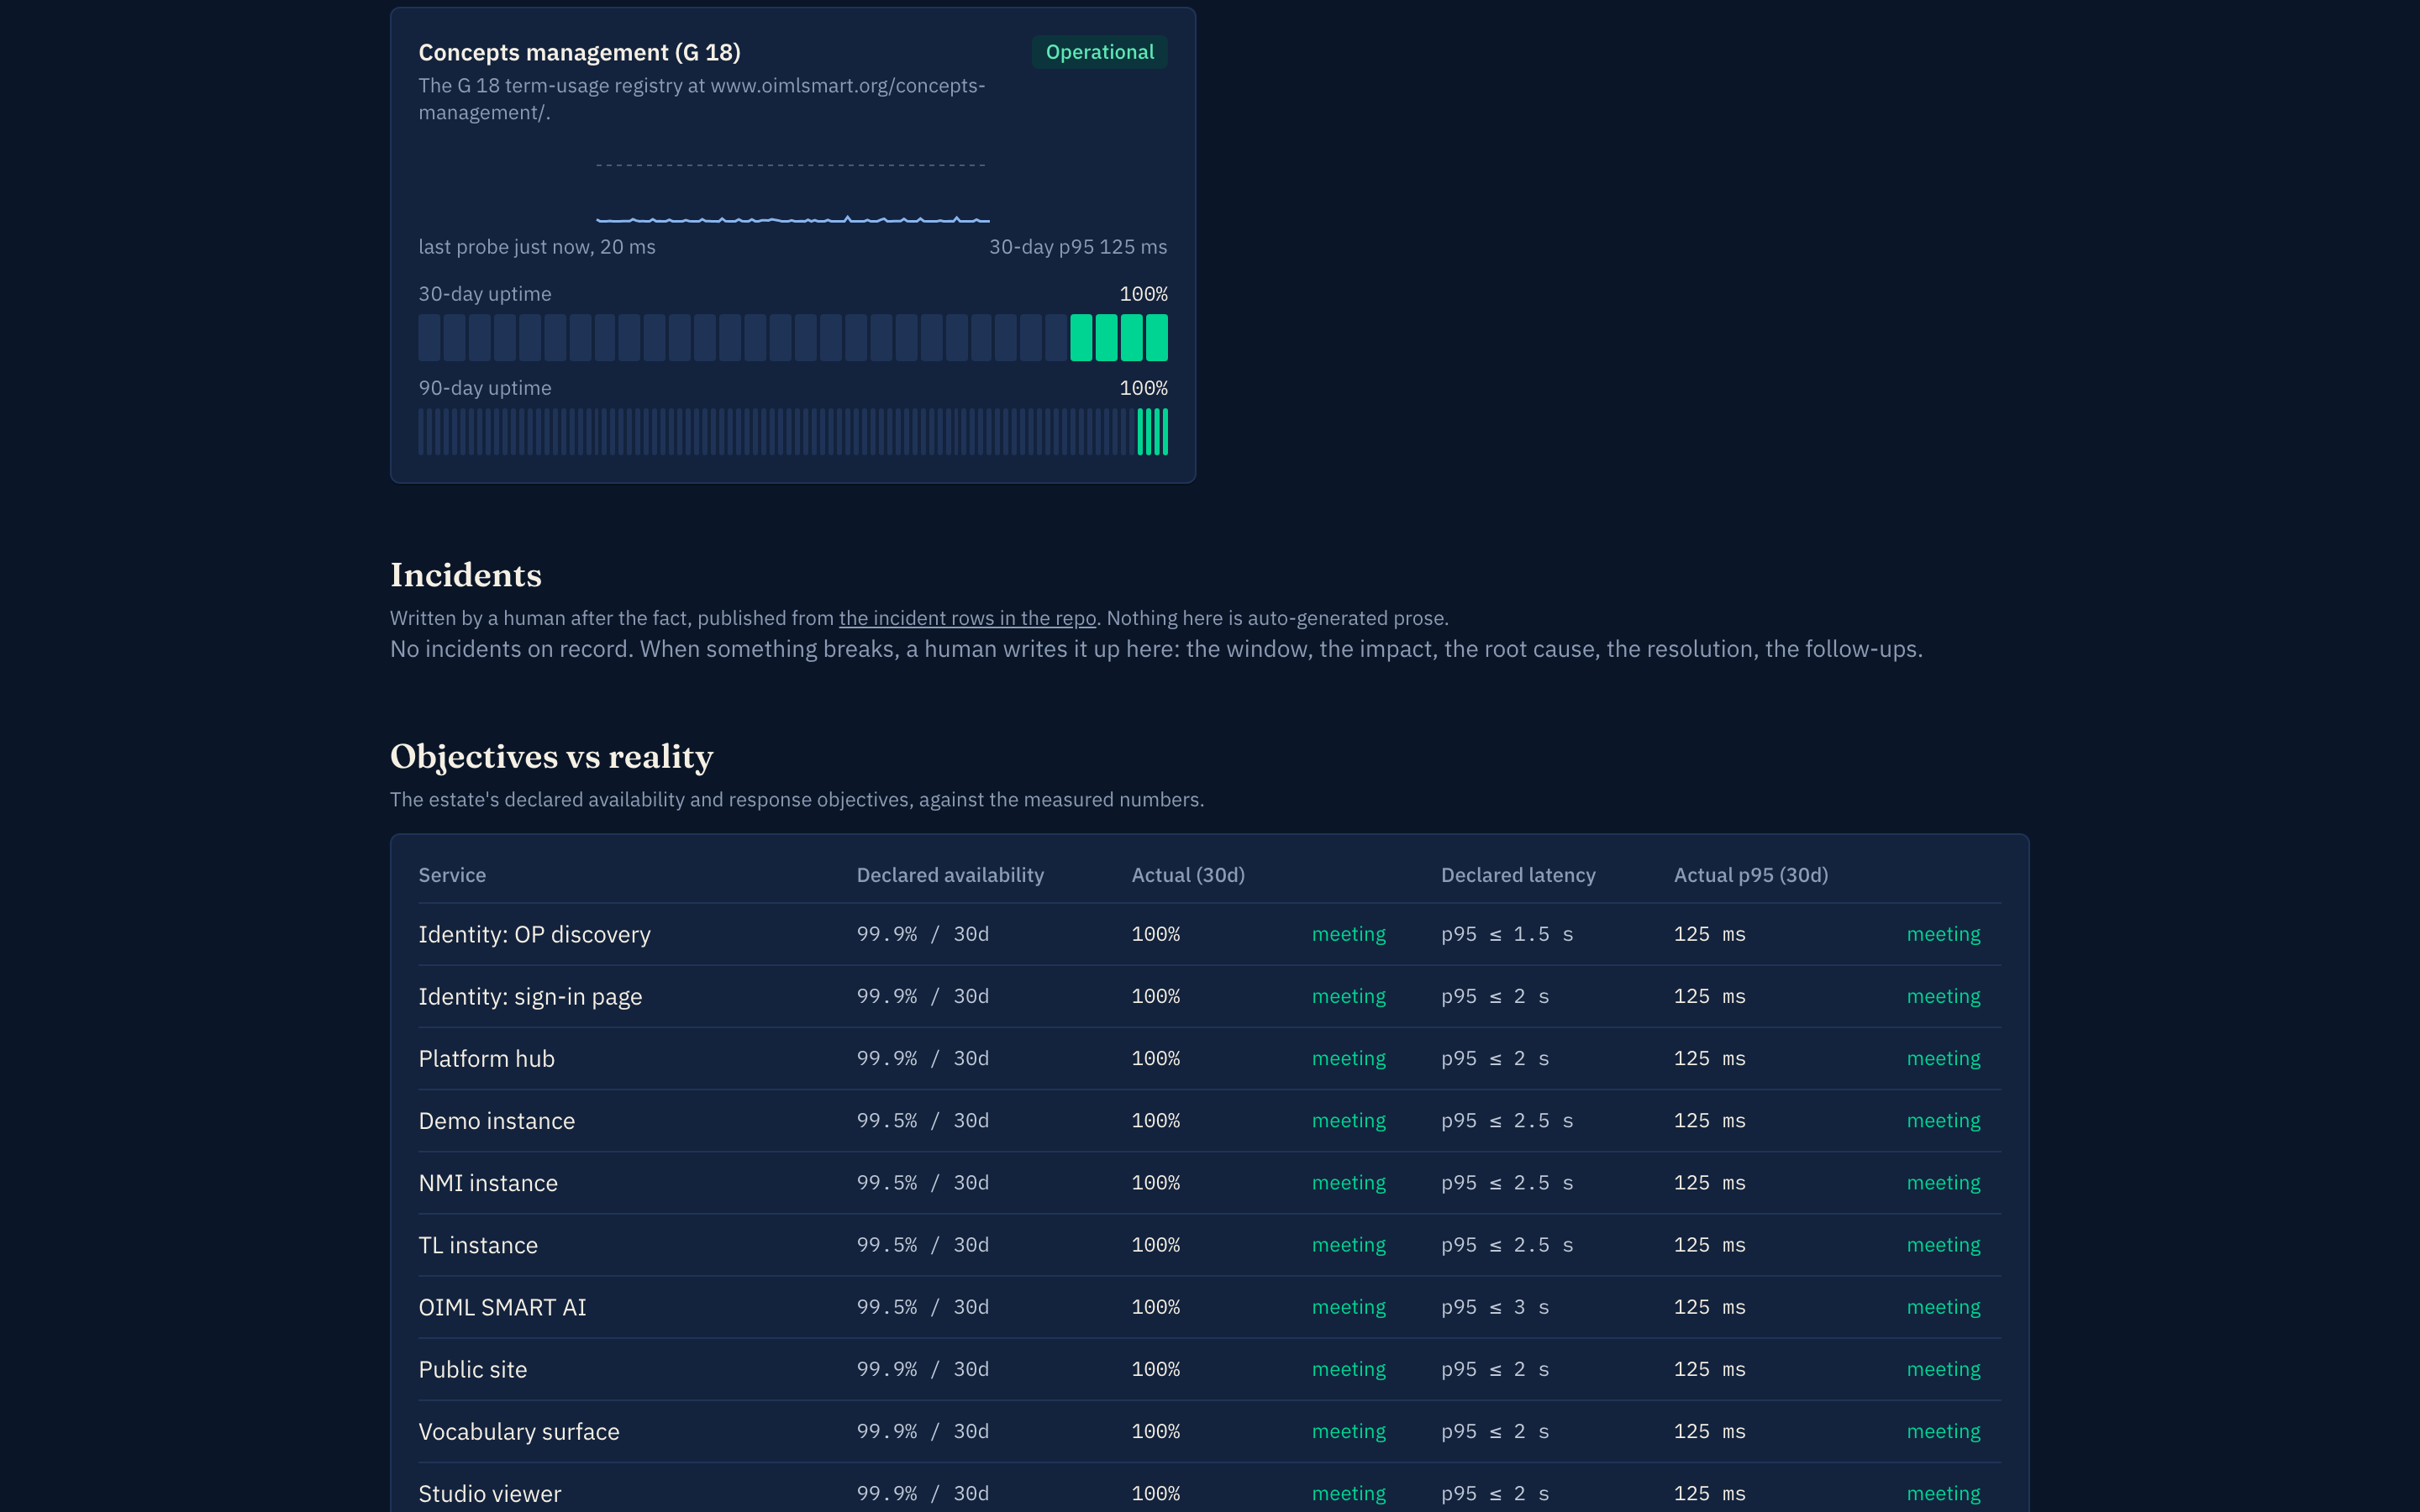
Declared versus measured, per service — captured 2026-08-29 by scripts/capture-services.ts 4. Read the incident record. Written by a human after the fact: the window, the impact, the root cause, the resolution, the follow-ups. When nothing has broken, the page says so, which is its own kind of evidence.
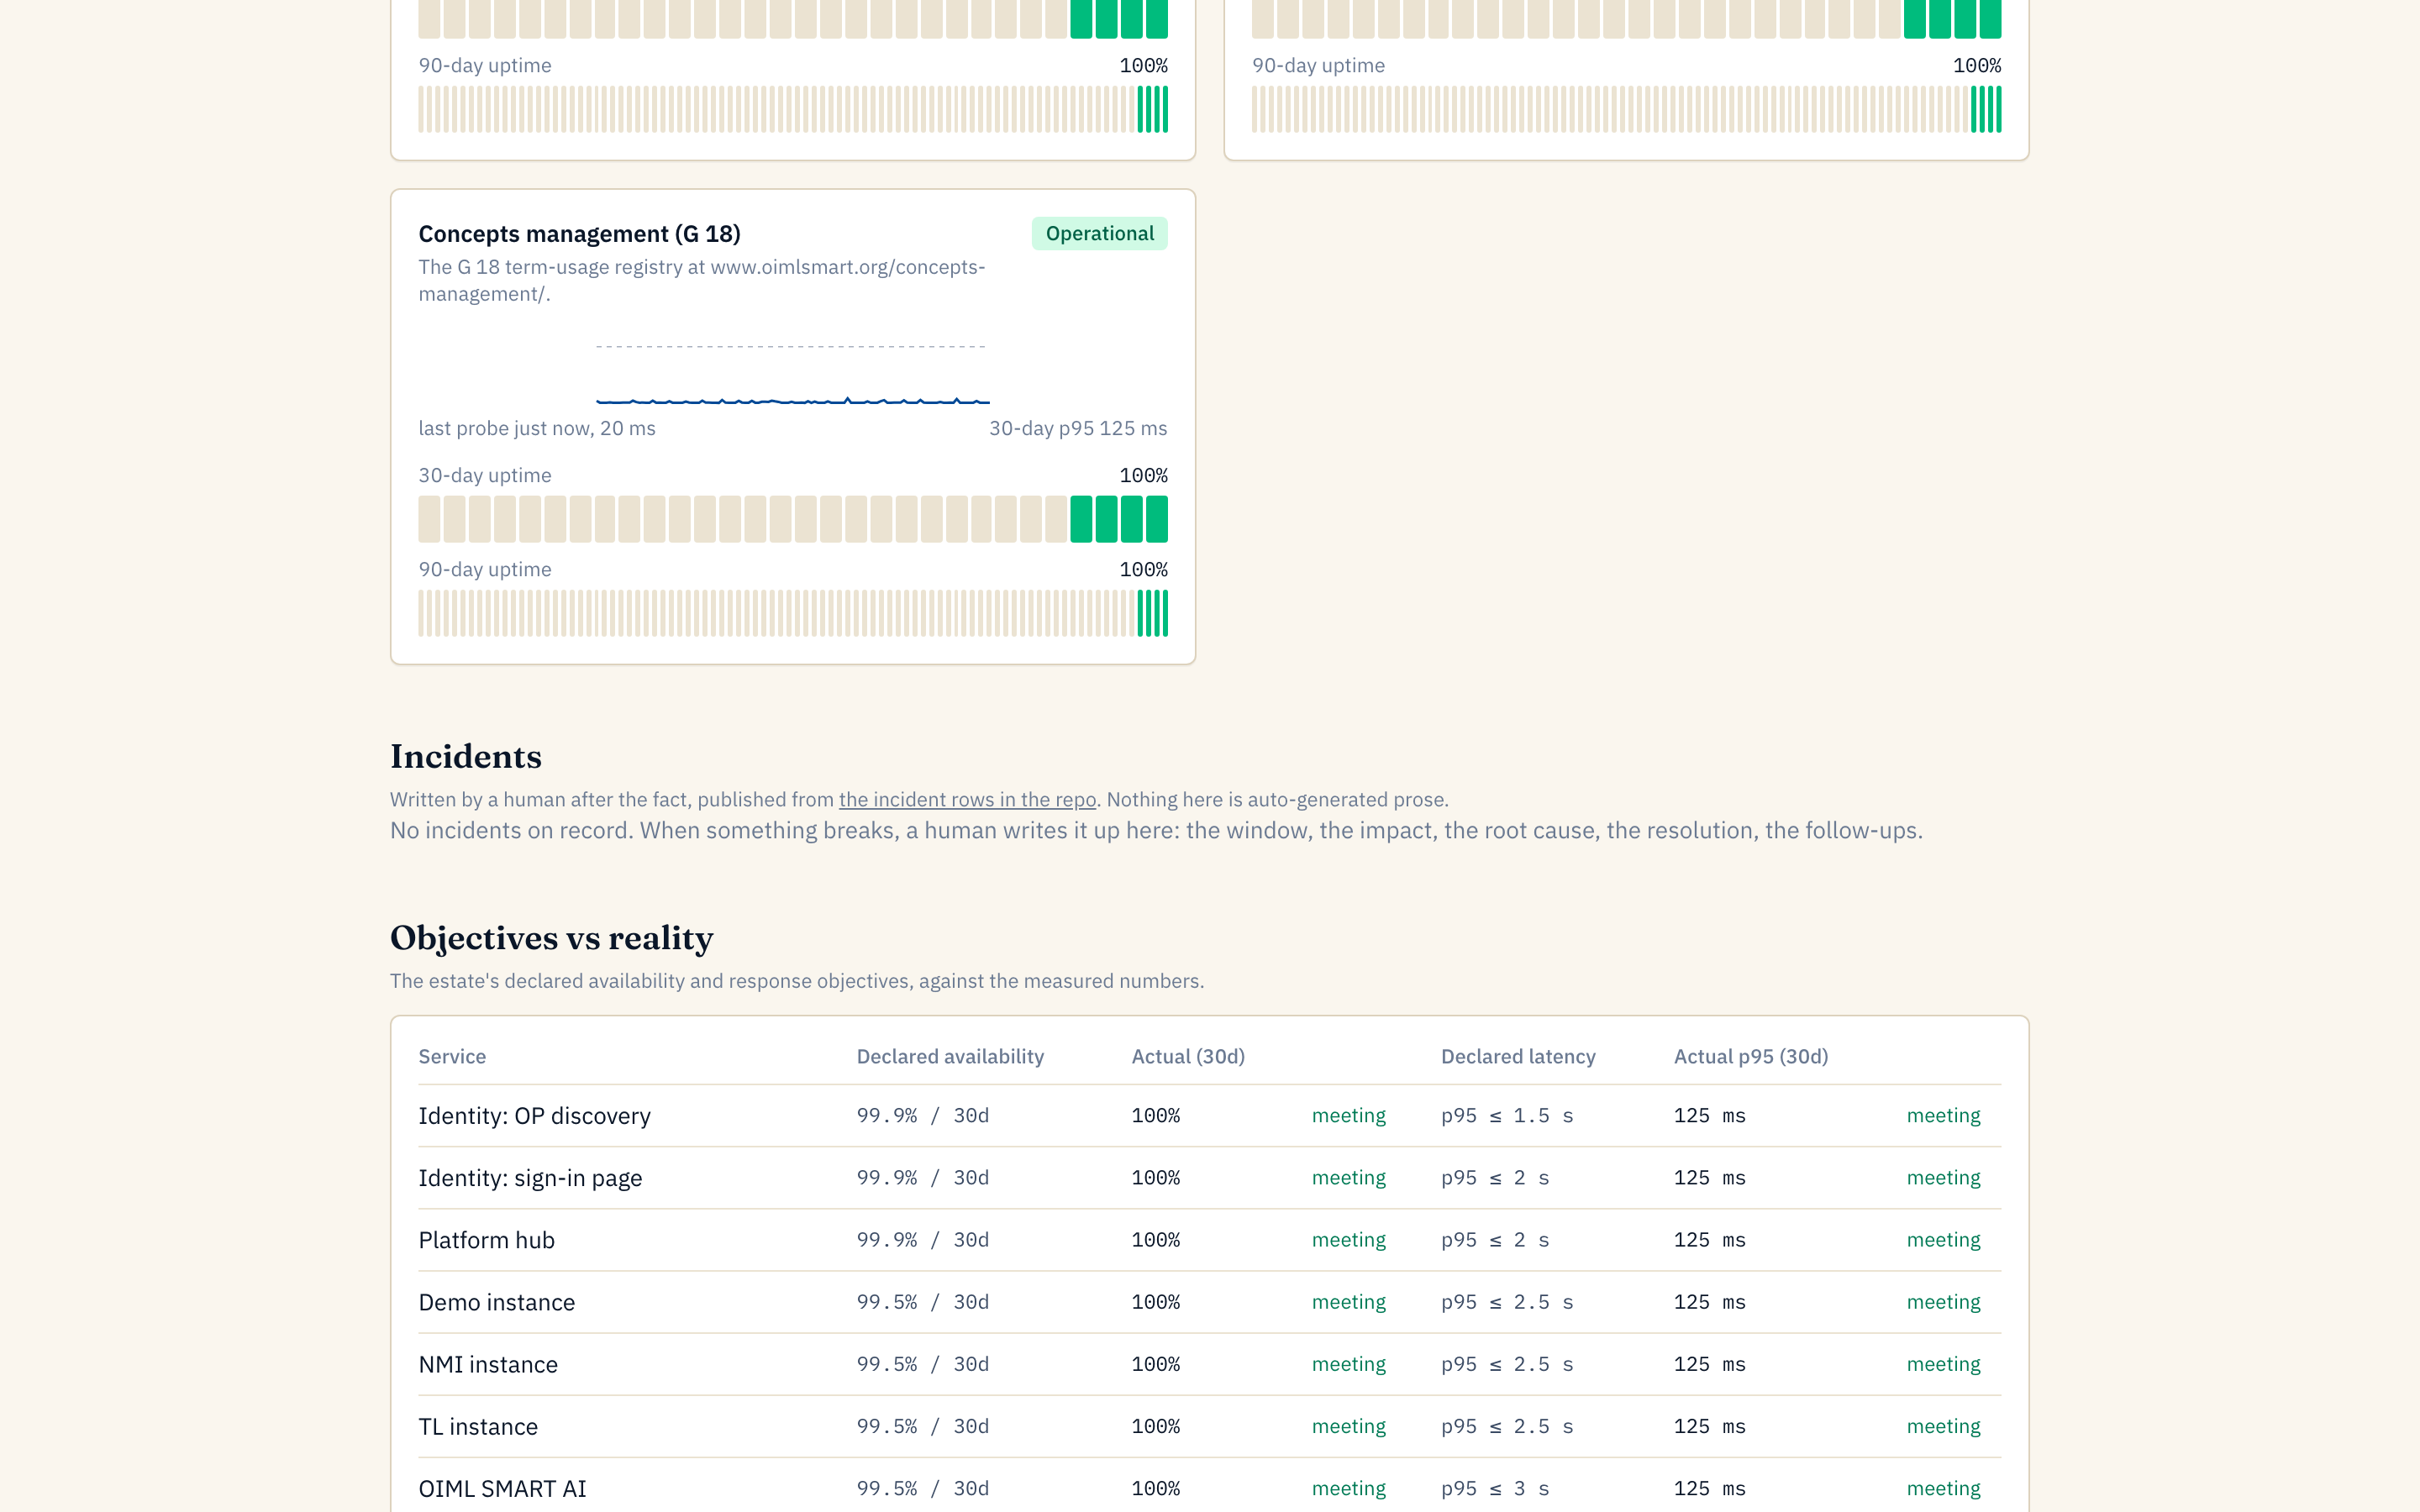
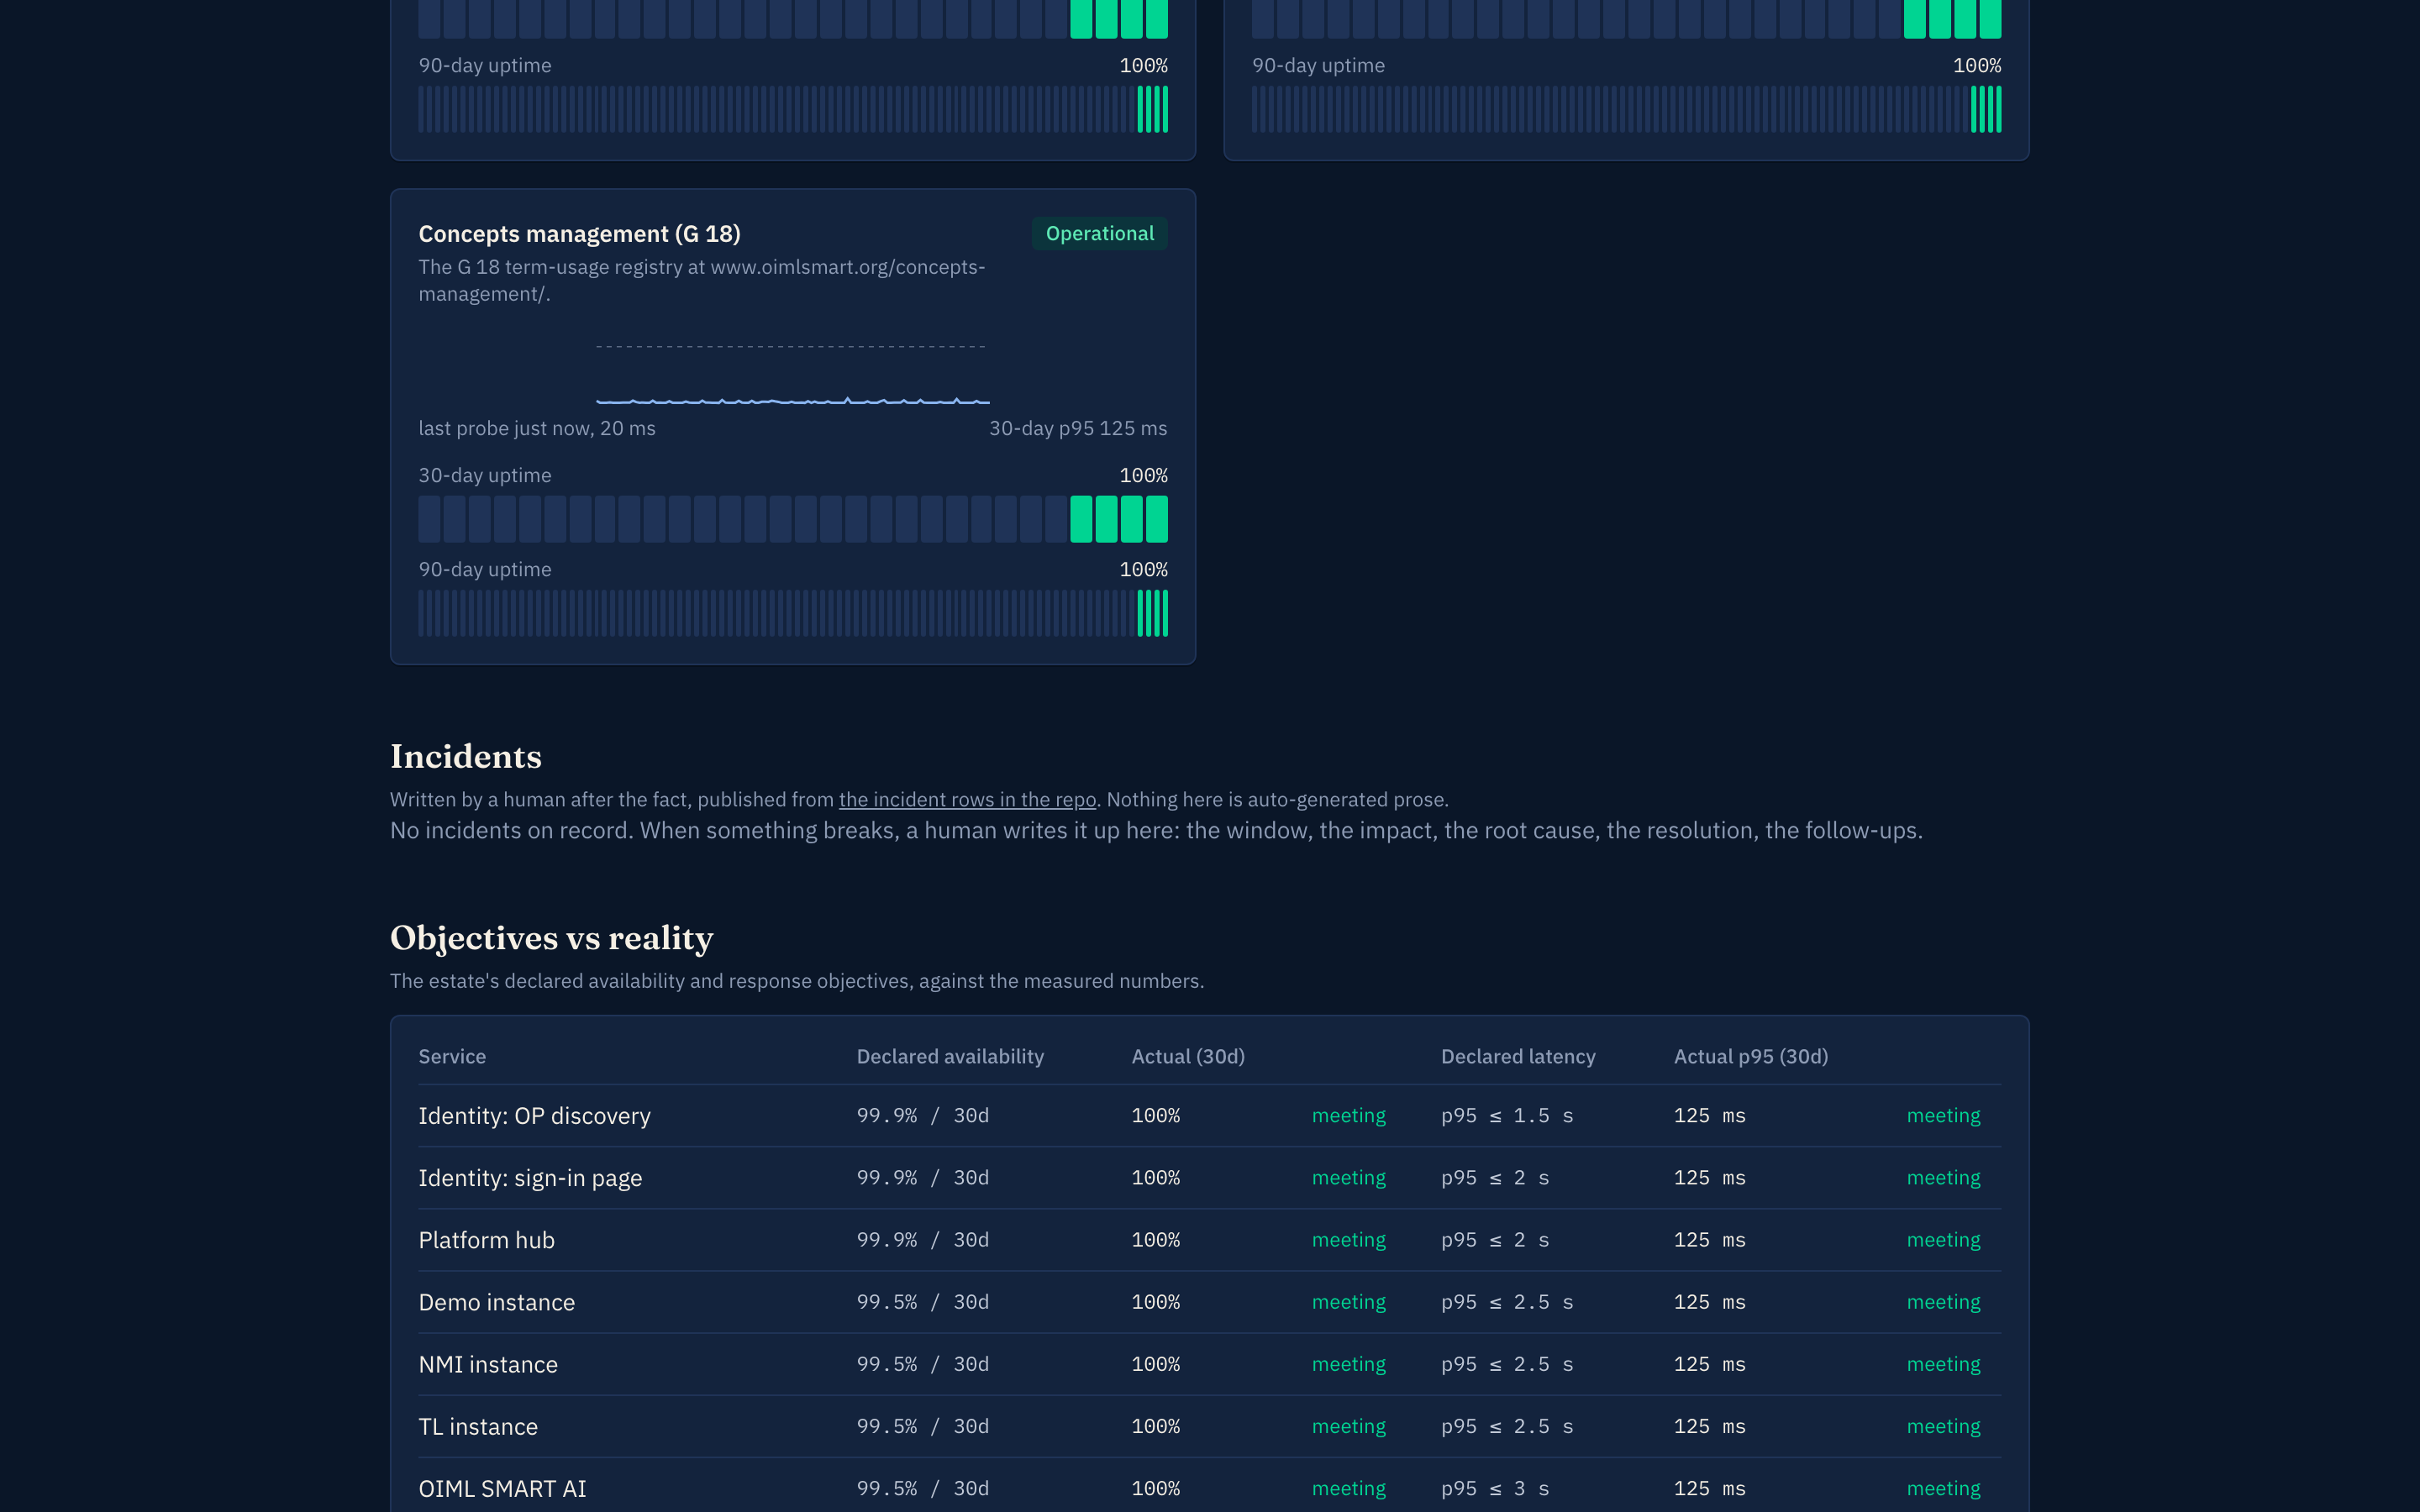
The incident record: human-written, and honest when empty — captured 2026-08-29 by scripts/capture-services.ts 5. Subscribe by feed. The incident timeline publishes as RSS 2.0 and Atom; both feeds answered 200 at capture time. Email subscription rides the program mailer posture and lands with the status tail wave; until then the page says feeds, because feeds are what exist.
6. Check the checker. The page publishes its own last-probe-run timestamp; if that timestamp goes stale, the prober itself is down and the page is showing the last known state. The freshness of the page is itself on the page.
How it works
One content-asserting request per service every sixty seconds, kept for ninety days; the page is generated from those probes, and the objectives table is computed from the same measurements it is checked against.
The status service does not probe itself: its page is the probe output, and adding a row for itself would assert what it cannot independently check. Its software (oimlsmart/status) is a member repository, source available to members.
SMART today, SMART+ next
SMART · LIVE TODAY
All twelve rows above are the live SMART services: the certification services, the identity service, and the public surfaces, each probed with its content assertion.
SMART+ · THE ROADMAP TIER
As the SMART+ surfaces ship (the monitored twin fleet, the SST instruments beyond the pilot), they join the probe list with the same treatment: a declared objective, a measured actual, and an honest incident record. That extension is roadmap, anchored on the SMART Twin page.
Who can use it, who can run it
| Member State | Corresponding Member | Issuing Authority / Test Laboratory (of a Member State) | Utilizer / Associate | Applicant / public |
|---|---|---|---|---|
| ✅ | ✅ | ✅ | ✅ | ✅ public |
The status service, quoted from the program's single entitlement source; the full matrix, all services by all member categories, lives atWho can run what.
The honest questions
Why is there no status row for the status service?
Because it cannot independently check itself. The page is the probe output; the last-probe-run timestamp at the bottom is the honest self-check, and a stale timestamp tells you the prober is down.
Are the numbers ever rounded to look better?
No. Percentages truncate at two decimals, the p95 is computed from bucketed per-minute probe latencies, and a number is never rounded up to meet a target. The page says so itself, under the objectives table.
Can I get email alerts instead of a feed?
Not yet. Email subscription rides the program mailer posture and lands with the status tail wave; the RSS and Atom feeds are what exist today, and the page will say email when email exists.
Where to go next
The live page. No account; the feeds are one click from the subscribe section.
The demo instance the status page probes. Sign-in runs through the identity service, the cast assumed as personas.
info@oimlsmart.org, the programme's front-door address. Incident questions and feed requests land here.
Verified 2026-08-29: the page answered live with all twelve probe rows operational, the declared-versus-actual objectives table, the empty incident record, and both feeds (RSS and Atom) returning 200; the captures and their assertions are in public/img/services/manifest.json.